Zooming in on the New HerdOptimizer

HerdOptimizer consists of five tab pages and a contact page.
- Dashboard
The first screen you will see when you log in. This screen has been designed to display a summary of the application at a glance. It provides instant access to the most important herd data. - Selection
This screen supports you in selection and mating. The SireMatch (if used) results is desplayed here. This screen displays an overall picture of your herd. - Evaluation
This allows you to zoom into the current genetic preposition of the herd. The breeding values and genetic conditions are displayed here for groups of animals and you can compare the potential of the herd with the performance of your herd. - Breeding goal
This screen displays the breeding goal for your herd. If you are not a SireMatch participant, you can also set the breeding goal on this page. - Settings
You can use settings to set HerdOptimizer according to your personal preference and herd strategy. - Service
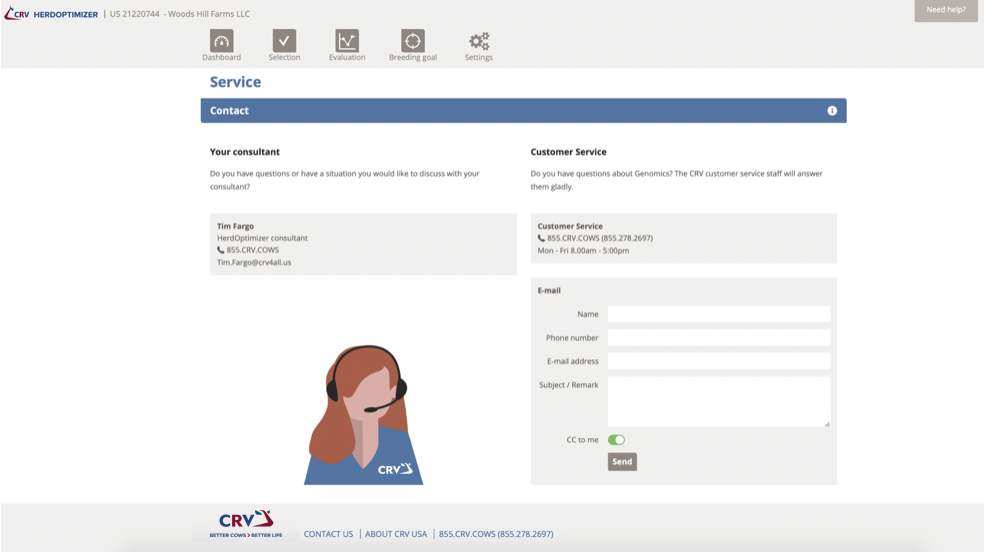
The service screenpage shows your HerdOptimizer adviser. You can also ask questions or send comments to the Customer Service team.
Dashboard
In this section you can find e.g.:
- any new tests that have been received
- track & trace the test in progress
- indication where the outstanding results due for the requested genomic marker test are in the logistics process
- overview of the number of tests in the chosen timescale
- explanation of what went wrong with a test; e.g. not enough DNA, registered pedigree problems
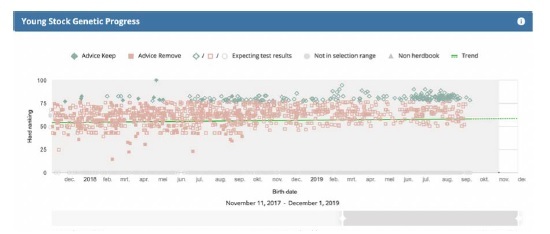
- a graph supports the selection process (see image Graphic Young Stock)
- a graph displays each animal born in the past year i.r.t. its position in the herd, based on its breeding value within the breeding goal
- colors indicate which animals are recommended for culling and which should be kept in the herd
- click a symbol to access the animal page of this specific animal
- herd overview, categorized into animal groups
2. Selection support
Our application supports selection and mating. Select which animals you want to see in order using the input fields and drop-down windows. HerdOptimizer displays a list of female animals, categorized according to age in the herd, based on the set breeding goal. Our application will examine the settings. For example:
- The setting is 50 calves required per year. You select the animals between 0 and 2 months on this screen. Based on this, HerdOptimizer will calculate that out of this group (50:12) x 2 equals eight calves that should be kept. You will get 'keep' advice for the eight highest-scoring animals.
Of course, you can overrule the advice. This will not alter the animals' ranking on the displayed list. You can also see that the list contains animals with a genomic marker test that is still in progress. The order of animals may change when the genomic breeding values of this animal are known. The more animals in the list that are still being tested, the more likely the order of animals will change.
More comfort:
- Request a genomic marker test for new female Holstein cows
- The SireMatch advice list is displayed at the bottom of the selection screen and on the animal page
- Each animal in the herd has a specific page, called animal result. This is also for non-genotyped animals and male animals
- Animal data presents the animals' important data in a single overview (including the ranking in the herd and pedigree)
- Breeding values of the animal are displayed under the SireMatch advice
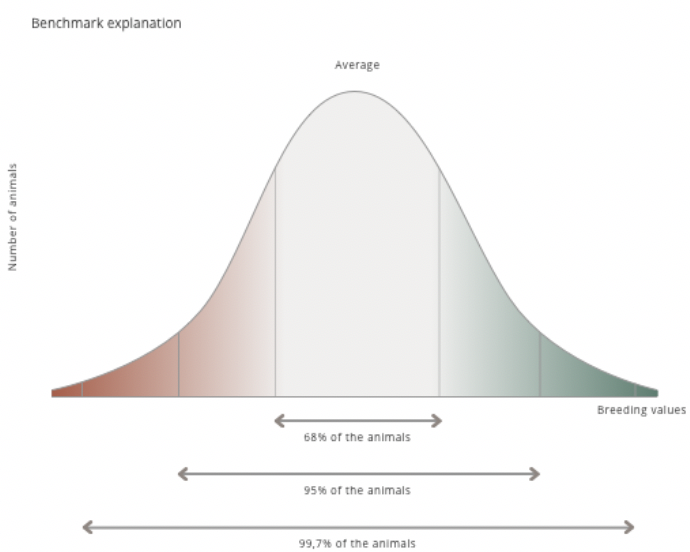
- Each breeding value is immediately compared with the herd average (see image Benchmark explanation)
Breeding goal
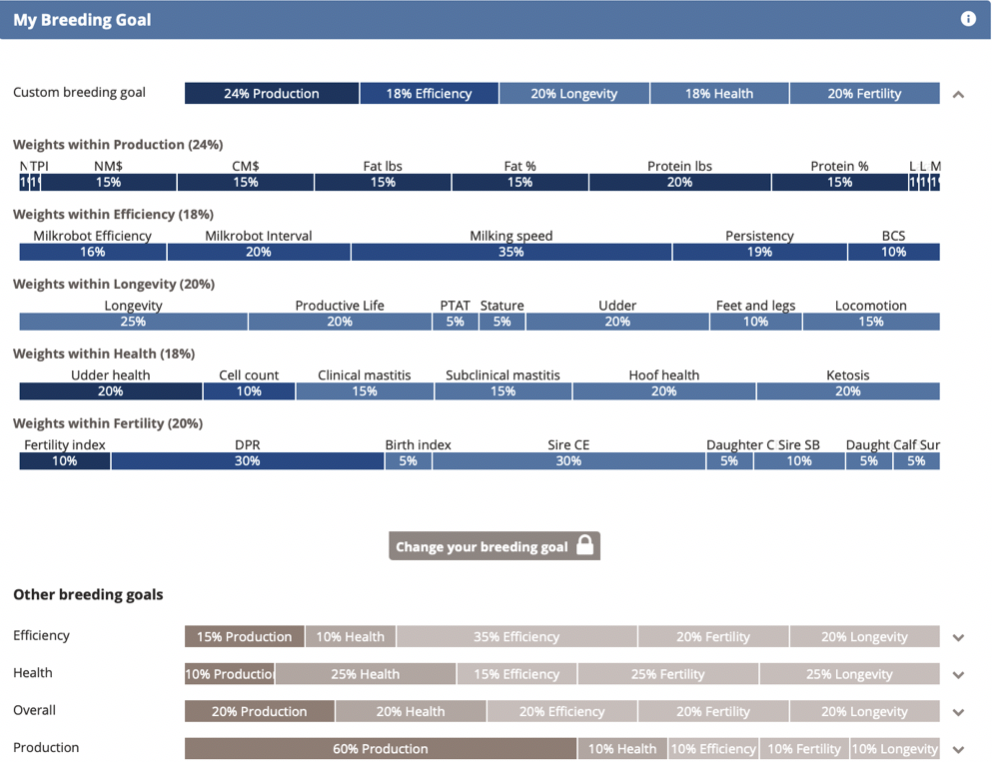
'My breeding goal' indicates which breeding goal is set. If wished, a selection can be made from CRV's standard breeding goals on a screen. Rather determine a breeding goal yourself. No problem! Do this via your own breeding goal, at the bottom of the list. Create your own breeding goal by moving the bars between the traits.
You can even determine the weighting of the breeding goal on a deeper level.
HerdOptimizer uses the set breeding goal as an index trait.
HerdOptimizer uses the set breeding goal as an index trait. An index breeding value is calculated for each animal in the herd as soon as a breeding goal has been determined. This value is then used to determine the ranking of the animals within the herd. This is called the ‘ranking no.’. Is the animal’s ranking no. 11? This indicates that the animal is ranked in the eleventh place in the herd, according to your breeding goal.
Evaluation
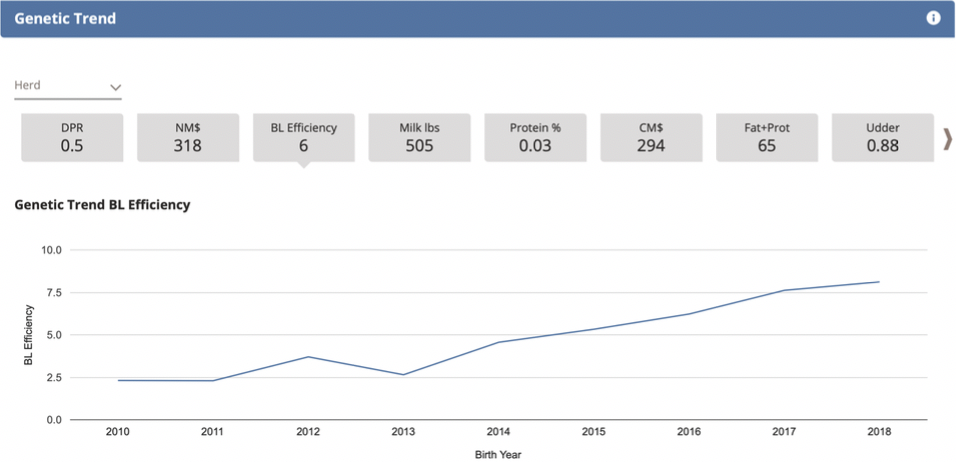
Take a look at the breeding values of all animals in the herd. Firstly, the eight traits selected as most important under 'Settings' are displayed. You can click on every animal number. You will directly see the animal result.
A heatmap is shown too. The average of each individual animal compared to the herd. Green means higher than the average. Red means below the average. Grey means an average score for the selected trait.
The animals can be compared in the same way with the young stock, the heifers, or the dairy cattle of parity 2 and higher. They can also be compared with the basis of the traits (for many traits this will be 100, the average).
Genetic development shows the evolution of the breeding value per year of birth
This allows you to evaluate the effectiveness of your breeding choices on this breeding value.
Settings and service
You can personalize HerdOptimizer to your personal preference and herd strategy. For example:
- Categorise your animal groups according to your preferences
- Change the number of required calves or advice period
- Select your own eight breeding values
- Set alerts for breeding values and hereditary traits/defects
Service
Find the HerdOptimizer manual on our website. If you still have questions you can always contact us. Depending on your question you can contact your HerdOptimizer adviser or customer service.
Brochure HOGO
Please download our brochure the NEW HerdOptimizer
